The followinq very simple program plots an extremely intricate and colourful pattern, from a function given in the proqram. In effect, the program evaluates the function at every point an the screen, and plots a coloured point the colour of which depends on the value of the function at that point. The result is a contour map of the function, with successive contour lines shown in different colours.
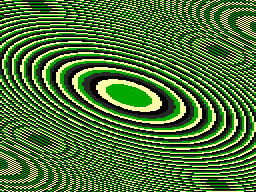
The plot shown below is produced by the equation z=x^2+y^2+xy (rearranged to increase the speed), which produces a series of elliptical contours. The secondary circles near the edges of the pattern are caused by an interaction between the ellipses and the screen matrix:
BBC Computer Version
For the BBC Computer version the program uses mode 5, available on the model A, which gives 4 colours at a resolution of 160x256. Integer variables are used, for maximum speed:
5 REM ... Contours ...
10 MODE 5
Turn cursor off, then for every point on the screen plot a point whose colour depends on the function.
15 VDU 5
20 FOR X%=-80 TO 80: FOR Y%=-128 TO 128
30 GCOL 0,((X%*(X%+Y%)+YS*Y%)/100) AND 3
40 PLOT69,(X%+80)*8,(Y%+128)*4
50 NEXT: NEXT
60 END
Atom Version
The Atom version uses mode 4a, which gives 4 colours at a resolution of 128x192:
5 REM ... CONTOURS ...
10 CLEAR 4
For every point on the screen plot a point whose colour depends on the function.
20 FOR X=-64TO64; FOR Y=-96TO96
30 COLOUR((X*(X+Y)+Y*Y)/100)
40 PLOT13,(X+64),(Y+96)
50 NEXT;NEXT
60 END
Further Suggestions
The following functions can be tried, in line 30 of the programs:
Function:		Contour shape:
(X*X+Y*Y)/100		Circles
((X*(X+Y)+Y*Y)/100	Ellipses
(X*X-Y*Y)/100		Hyperbolae
(X*(X+Y)-Y*Y)/100	Bent hyperbolae
The constant, 100, can be increased to increase the width of the coloured bands.
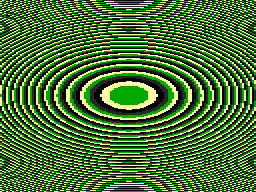
Circles:
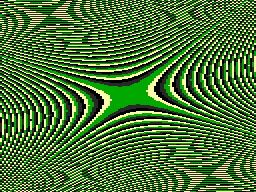
Hyperbolae:
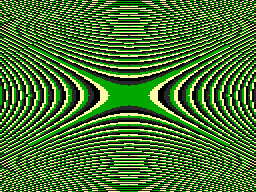
Bent hyperbolae: